Late last week, the Bay Citizen ran a story on the percent of the Bay Area population that is living in poverty, based on new data from the U.S. Census Bureau.
The government defines a family as living in poverty if their annual household income income is less than $22,113.
The article includes a map with shaded areas indicating poverty level. The image below shows the neighborhood, which features several areas designated as having 8% to 20% of its residents living in poverty.
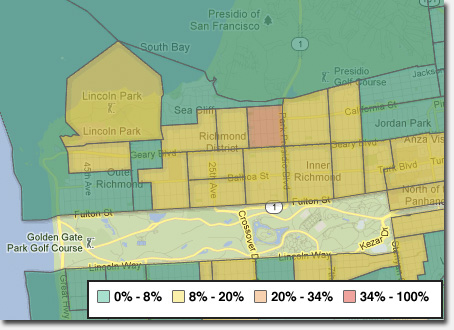
One small section of the neighborhood – from Geary to Lake Street, and 19th Avenue to Park Presidio – is shaded red, indicating that 20% to 34% of the population there is living in poverty. Of the 3,666 that live there, 740 are in poverty (20.2%). It also states 213 are in extreme poverty, though it’s unclear if the 213 are part of the 740, or in addition to.
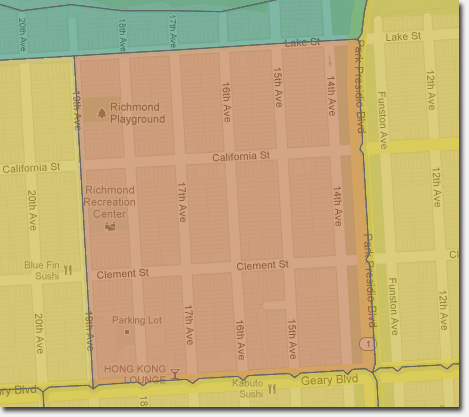
It’s interesting that this one pocket of the neighborhood exhibits such a high level. In fact it’s the only area at that level of poverty in the western end of San Francisco. The next closest “20% – 34%” area is in the Fillmore.
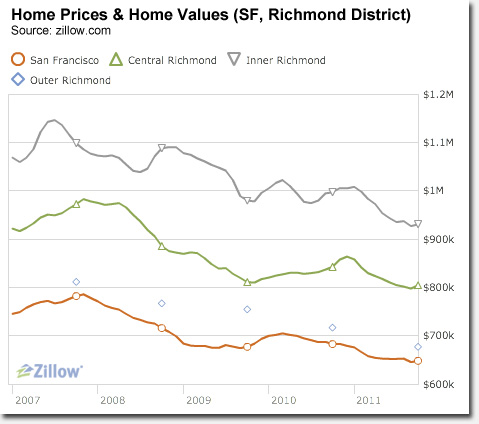
You wouldn’t know it walking around that neighborhood, filled with quaint, well kept single-family homes on Lake Street and well-maintained apartment buildings on every block. A brief look at Zillow indicates homes are selling in that grid beginning at $699k up to $1.5M. There’s even a flat that rents for $5,400 a month.
Which all gets back to the Bay Citizen’s original story angle, which is that rich and poor are living side by side in San Francisco. Why should the Richmond District be any different?
Nevertheless, I’m surprised that this “impoverished” section is also in one of the most sought after areas for real estate in the neighborhood.
So did something go awry with the data that was collected? What do you think? Real data or a data aberration?
Sarah B.
I looked at the Bay Citizen map at their site, and clicked on that red/orange shaded area. Their pop-up caption says it indicates that 20.2% of residents in that area live in poverty, not 34-100%. Twenty percent is still not good, but it’s not as bad as their shading indicates.
From the site:
“Location: Census Tract 426.02, San Francisco County, California
Total population: 3666
Residents in poverty: 740
Percent of residents in poverty: 20.2
Residents in extreme poverty: 213”
Source: The Bay Citizen (http://s.tt/14J0t)
One suspects a problem with data entry–as in, 740 for 74, or something of the sort.
I live in that zone. 34-100 seems high. If that number is true they are pretty well-hidden. I imagine that some of that poverty is definitely there – I see old Chinese ladies dumpster diving for recyclables in my hood. I do get the sense that some of the elderly immigrant population in the area are struggling. But 34-100 seems off.
It’s actually shaded for 20-34%, not 34-100%, so at 20.2% the map is accurate. And since it’s only fractionally higher than the range of the surrounding blocks, it is less of an anomaly. Still, the question as to why this particular zone has a poverty rate 10% higher than the surrounding neighborhoods is an curious one.
When looking at those same maps you’ll see that the areas right around the Berkeley campus are noted as being high poverty, too. It very well could be the case that non-students living near the Berkeley campus are more likely to be in poverty, but it nonetheless makes me suspicious that at least some students might have snuck into the analysis. To my knowledge, this area of the Richmond isn’t especially close to any of SF’s biggest colleges or universities, but perhaps by coincidence it has a higher percentage of students, some or all of which are skewing the data.
I don’t buy it. Does a few hundred thousand (or a few million) in the bank count as annual income? Or how about owning a home mortgage-free with a few hundred thousand (or a few million) in equity? Yes, these are assumptions on my part, but I have a very hard time believing the data.
Having taken a second, closer look at the data I am now convinced that these data are erroneous and highly skewed, at least by student presence, if not by other factors as well.
In every case I checked, the total population numbers given for the census tracts are simply wrong. Census tract 4228 next to the Cal campus has a population of 8,368, not 2,922 as the map shows. Of the 8,368 census-counted residents in Berkeley tract 4228, approximately 7,500 or about 90% are between the ages of 18 and 29 and are thus likely undergrad or graduate students. This is going to confound any cursory attempt to analyze poverty.
Other examples of incorrect numbers include: Berkeley census tract 4226 which their map shows with a population of 66, when its population is actually 1,215; Oakland tract 4054.02 has an actual population of 3,114 but their map shows it as 2,758.
It’s possible that they are employing some advanced methodology that is resulting in numbers that only seem incorrect, but that is something they should make clear–especially when they say things like “Total Population” and then give a number that is decidedly not the total population.
Thanks guys, my fine color recognition skills were clearly faltering when I wrote this. 🙂 It is indeed the 20-34% proverty level. I made some corrections. Nevertheless, troubling.
Sarah B.
how do you even live in sf earning $22k a household a year? that seems more like the average annual rent for a 1 bedroom sf. confused.
@Andrew: When I first moved here I made around that, and paid $1000 for a studio. I ate lots of Top Ramen and cut back on some entertainment – some of the happiest times of my life, actually. 😉 So it’s possible.
There are many elderly people living in that section of the Richmond. I wonder if that skews the data as their income would be low (e.g. social security); however, if many have lived in the neighborhood for years, their home may be paid for. This would free up a major component of their income.
I don’t believe these numbers, either. It could be there are a lot of students living there in apartments, or there’s a lot of under-reporting going on. Certain cultures despise giving income information to pollsters.
I live in this sector and have been unemployed the majority of this year. I’m single and live in an affordable apartment, but I have no income. I’ve been living off the last of my savings and I’m on food stamps. You wouldn’t judge me as poor passing me on the sidewalk walking my dog. But I’m here, and I look at other people and wonder if they’re poor, too.
Richmond is a renter-heavy neighborhood
Is there an old folks home or a large number of relatively inexpensive multi-unit apartments?
@Sarah, Perhaps now that the error’s been uncovered, you can rewrite the article. This version could drive down home values in the Richmond. Many thanks.
I would like to see a block by block analysis. It’s highly doubtful that any part of Lake St. is living in poverty, yet this analysis is skewed because it covers a 15 block radius and then paints the entire Lake area in those few blocks as 20+% impoverished. When I walk just 2 blocks toward Clement st., the street scape is noticeably different- trash all over the sidewalks, no trees, cars parked on paved over front yards, peeling stucco.
^^15 block area, not radius
For my public health class, I was researching poverty demographics at http://www.thehdmt.org/indicators/view/163. Because I was surprised to see that Seacliff neighborhood has 19% of its population living in poverty, I asked Epidemiologist Meg Wall the reason(s) for Seacliff’s 19% poverty rate. I wondered if Seacliff’s poverty rate is so high due to live-in domestic workers who earn less than poverty wages?
Meg Wall, MPH, responded: “it is probably unlikely that domestic workers have impacted this number due to a number of issues (i.e. whether their employer is actually including them on the form and whether they would readily report that they pay them such a low wage, etc.). I think it can safely be assumed that the VA population is responsible for that number.”
I would like to know the definition of “income” used. For instance, is is solely a review of W2 and W9 reported income, or is it all reported declared income, or is it backed out of taxed income? A reason that this matters is because of the “real” money a person uses through the year and the taxes paid. The classic example is that the wealthy can have most or all their money in investments, and investment income is only taxed at a fraction of earned income. While I am not at all suggesting that this is the case for this neighborhood, consider that many wealthy are only paying 12-15% percent income tax (the super wealthy can often find ways to pay virtually no income tax) while those of us who are regular wage earners are paying full freight on all our income.
There are many group homes in the Richmond housing elderly residents that are on a low/fixed income, yet can still live in a roomate situation in a nice neighborhood. That could skew the data.
This is a bit off topic, but is this area really the “outer” Richmond? I tend to think of the outer Richmond much further west.
I feel for anyone living in poverty.
The stats may be wrong if they are using tax returns, for these possible reasons:
– failure to file taxes
– definition of “household”: maybe 3 generations live together in what some would call a “household” but to save on taxes, they file as 3 different generations, in 3 households. The senior and the young-adult groups may show up as impovershed, even while living under their parents’ roof.
– a married couple could file as 2 separate households. Not sure if there’s an economic incentive of some sort, such as welfare benefits.
– hidden income
i just moved from 21st ave and clement a week ago (lived there for 2 years) and probably 85% or more of residents in my building (about 20 apartments) were elderly and ukrainian (i think – either that or russian). so they are likely on fixed incomes. i think in the area shaded red on the map, there are a good number of elderly russian residents, as well as elderly people of other nationalities. that could explain, in part, the high concentration of people in poverty there. i have to say though, 20.2% does sound much higher than i’d have thought.
@Sam – The story has been corrected to reflect the percentages called out by the Bay Citizen’s map (20-34%). But I can’t do anything about their mis-shading.
@Laura – For real estate maps they define the few blocks bordering Park Presidio as “Central Richmond” and as soon as you hit about 16th Avenue, they consider it outer Richmond. Technically the Richmond starts on Arguello so calling everything past Park Presidio either Central or Outer makes sense I think.
@Jessica & rebecca – Thanks for weighing in as residents of that section. Nice to get your perspective.
Sarah B.
@Sarah – the online real estate map of the SF MLS shows the central richmond going from Park Presidio to 32nd Ave. Click on District 1, then the Street View button.
http://www.sfarmls.com/docs/areamaps.htm
I believe a number of factors are skewing these data.
1. You have those who own their properties and are on fixed incomes (as many have noted).
2. That region is relatively close to USF. Although south of this demographic snapshop, I live on 20th Ave south of Geary and there are a number of USF students here. Additionally, the 28 Muni provides access to SF State in that region.
3. People who are roommates renting apartments. Most rent in Central Richmond is rarely below 2 grand, but with two to three people sharing a flat/apt the rent goes way down. Typically, the census relies on surveys as to households in addition to tax info from the IRS.
4. Mortgage and rent may be paid entirely or mostly by adult children for a two-to-three-story building with 2-3 flats. But, each generation will file their own tax return. For example, grandma and grandpa may not be paying the costs for rent/mortgage but they offer other assistance to their children such as cooking, housekeeping, and childcare. These situations are not uncommon within first and second generations from China, Eastern Europe, and Russia.
5. There could be elderly in which all of their assets and income are now in a trust. However, during the census survey, gathered info does not correlated to IRS data.
6. These latter groups are unlikely, but plausible: Any military (instead of additional income, they receive housing allotments to live off base, albeit locations in this region are quite far from current military installations), section 8, and any refugee status that receive assistance, will also skew data.
Where is the Annual Household Income data obtained?
Perhaps they’re the 1% living there, but claim so many deductions etc, that they appear to have a very low income (thus pay fewer taxes.)
Or wealthy children own such homes, let their parents live there, and list them as the owner. Then that way the parent’s SSI may show as $22k a year.