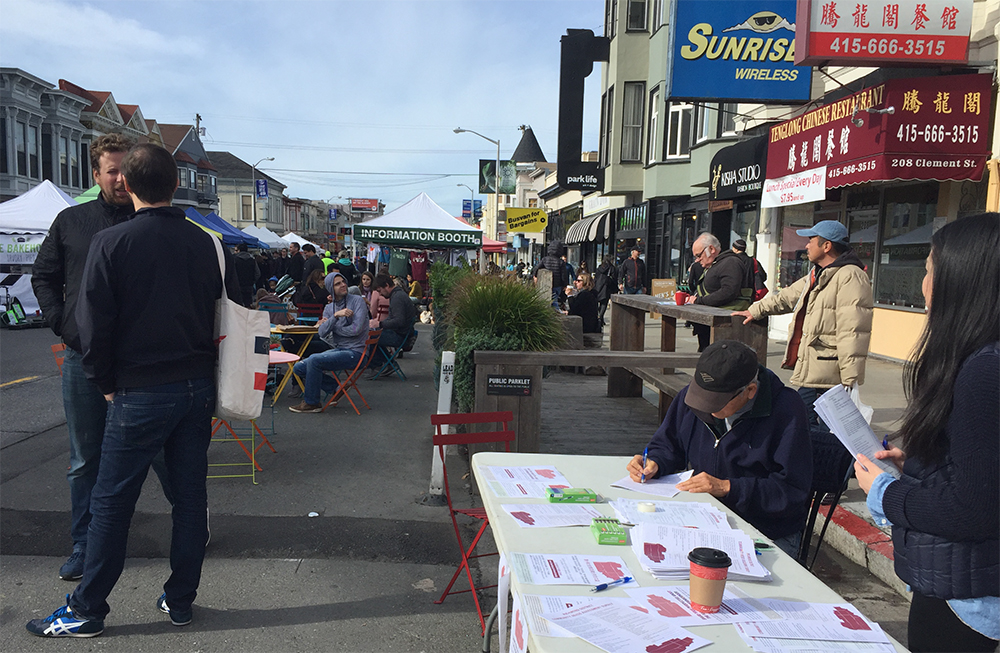
The Sunday Farmer’s Market on Clement Street near 3rd Avenue
Back in October 2015, we invited you to take a survey about needs in our neighborhood including housing, businesses, public facilities, public transportation, parks and more. The survey is part of Supervisor Mar’s Office and the San Francisco Planning Department Richmond District Strategy initiative:
This process will provide a comprehensive understanding of the District’s current trends, needs, and opportunities. The goal is to create a vision for the future of District 1 to ensure a sustainable and high quality of life for current and future generations who live, work and visit District 1.
As you’ll see from the findings, this effort is mostly tied to the future of housing and housing development in the Richmond District. Many of the conditions reported on, and questions asked in the needs assessment survey focus housing needs, and assessing residents’ desires for different development types and affordability levels.
Existing Conditions Report
The first part of the project produced an Existing Conditions Report (PDF), which offered these key findings (PDF):
- For the past 30 years, District 1’s population has grown at about half the rate of the City overall. In this same time period, the Asian population has doubled, growing from 21 percent to 42 percent, replacing a decreasing Caucasian population.
- ??District 1 hosts a disproportionally low share of the City’s new housing development (1 percent) and also a low share of below market rate units (2.4 percent).
- District 1 is also home to more families than the City overall: 50 percent of households are family households in District 1 compared to 44 percent citywide.
- The majority of District 1 residents are renters (64 percent), with a higher prevalence in the Inner Richmond than the Outer Richmond. Despite rents being lower than other neighborhoods, only one-third of families in the District can afford the current asking rent, which requires a family to earn $120,000 a year.
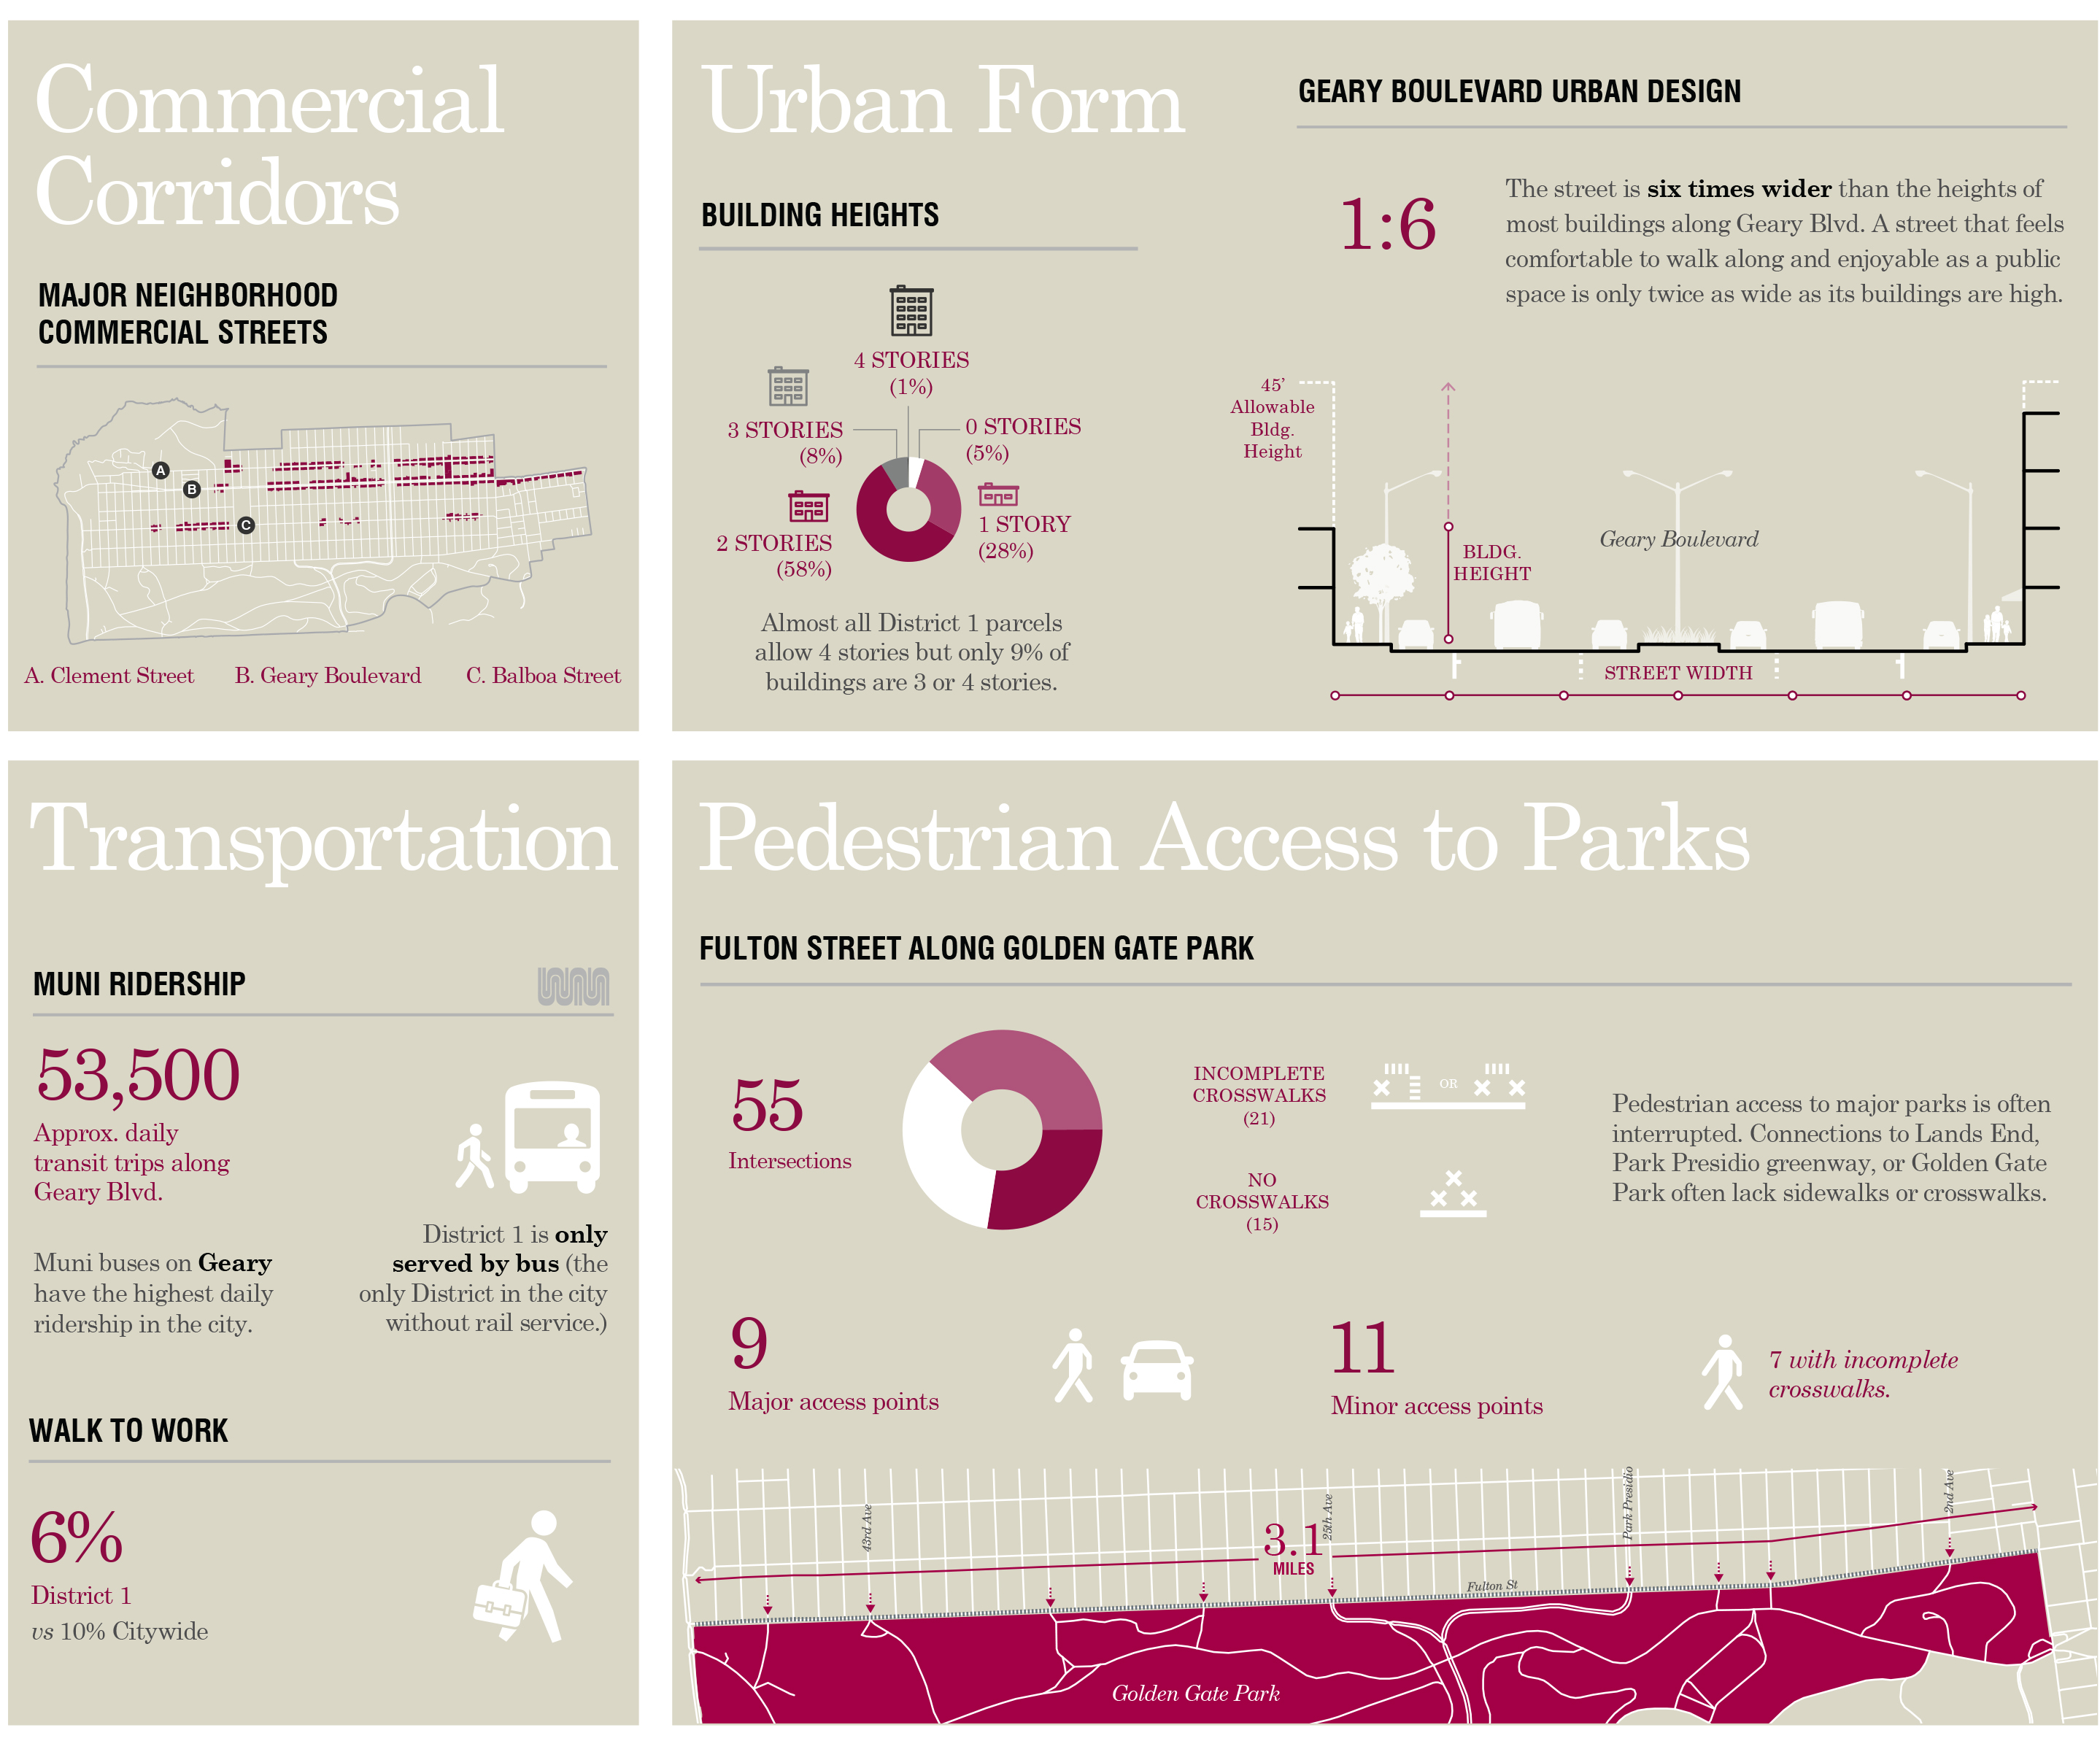
- District 1’s major parks and open spaces make up about 20 percent of the City’s total park space.
- Considerably more residents work from home but at the same time there has been over a 50
percent increase in the number of residents who commute an hour or more to/from work. Residents rely heavily on public transit for their daily commute.
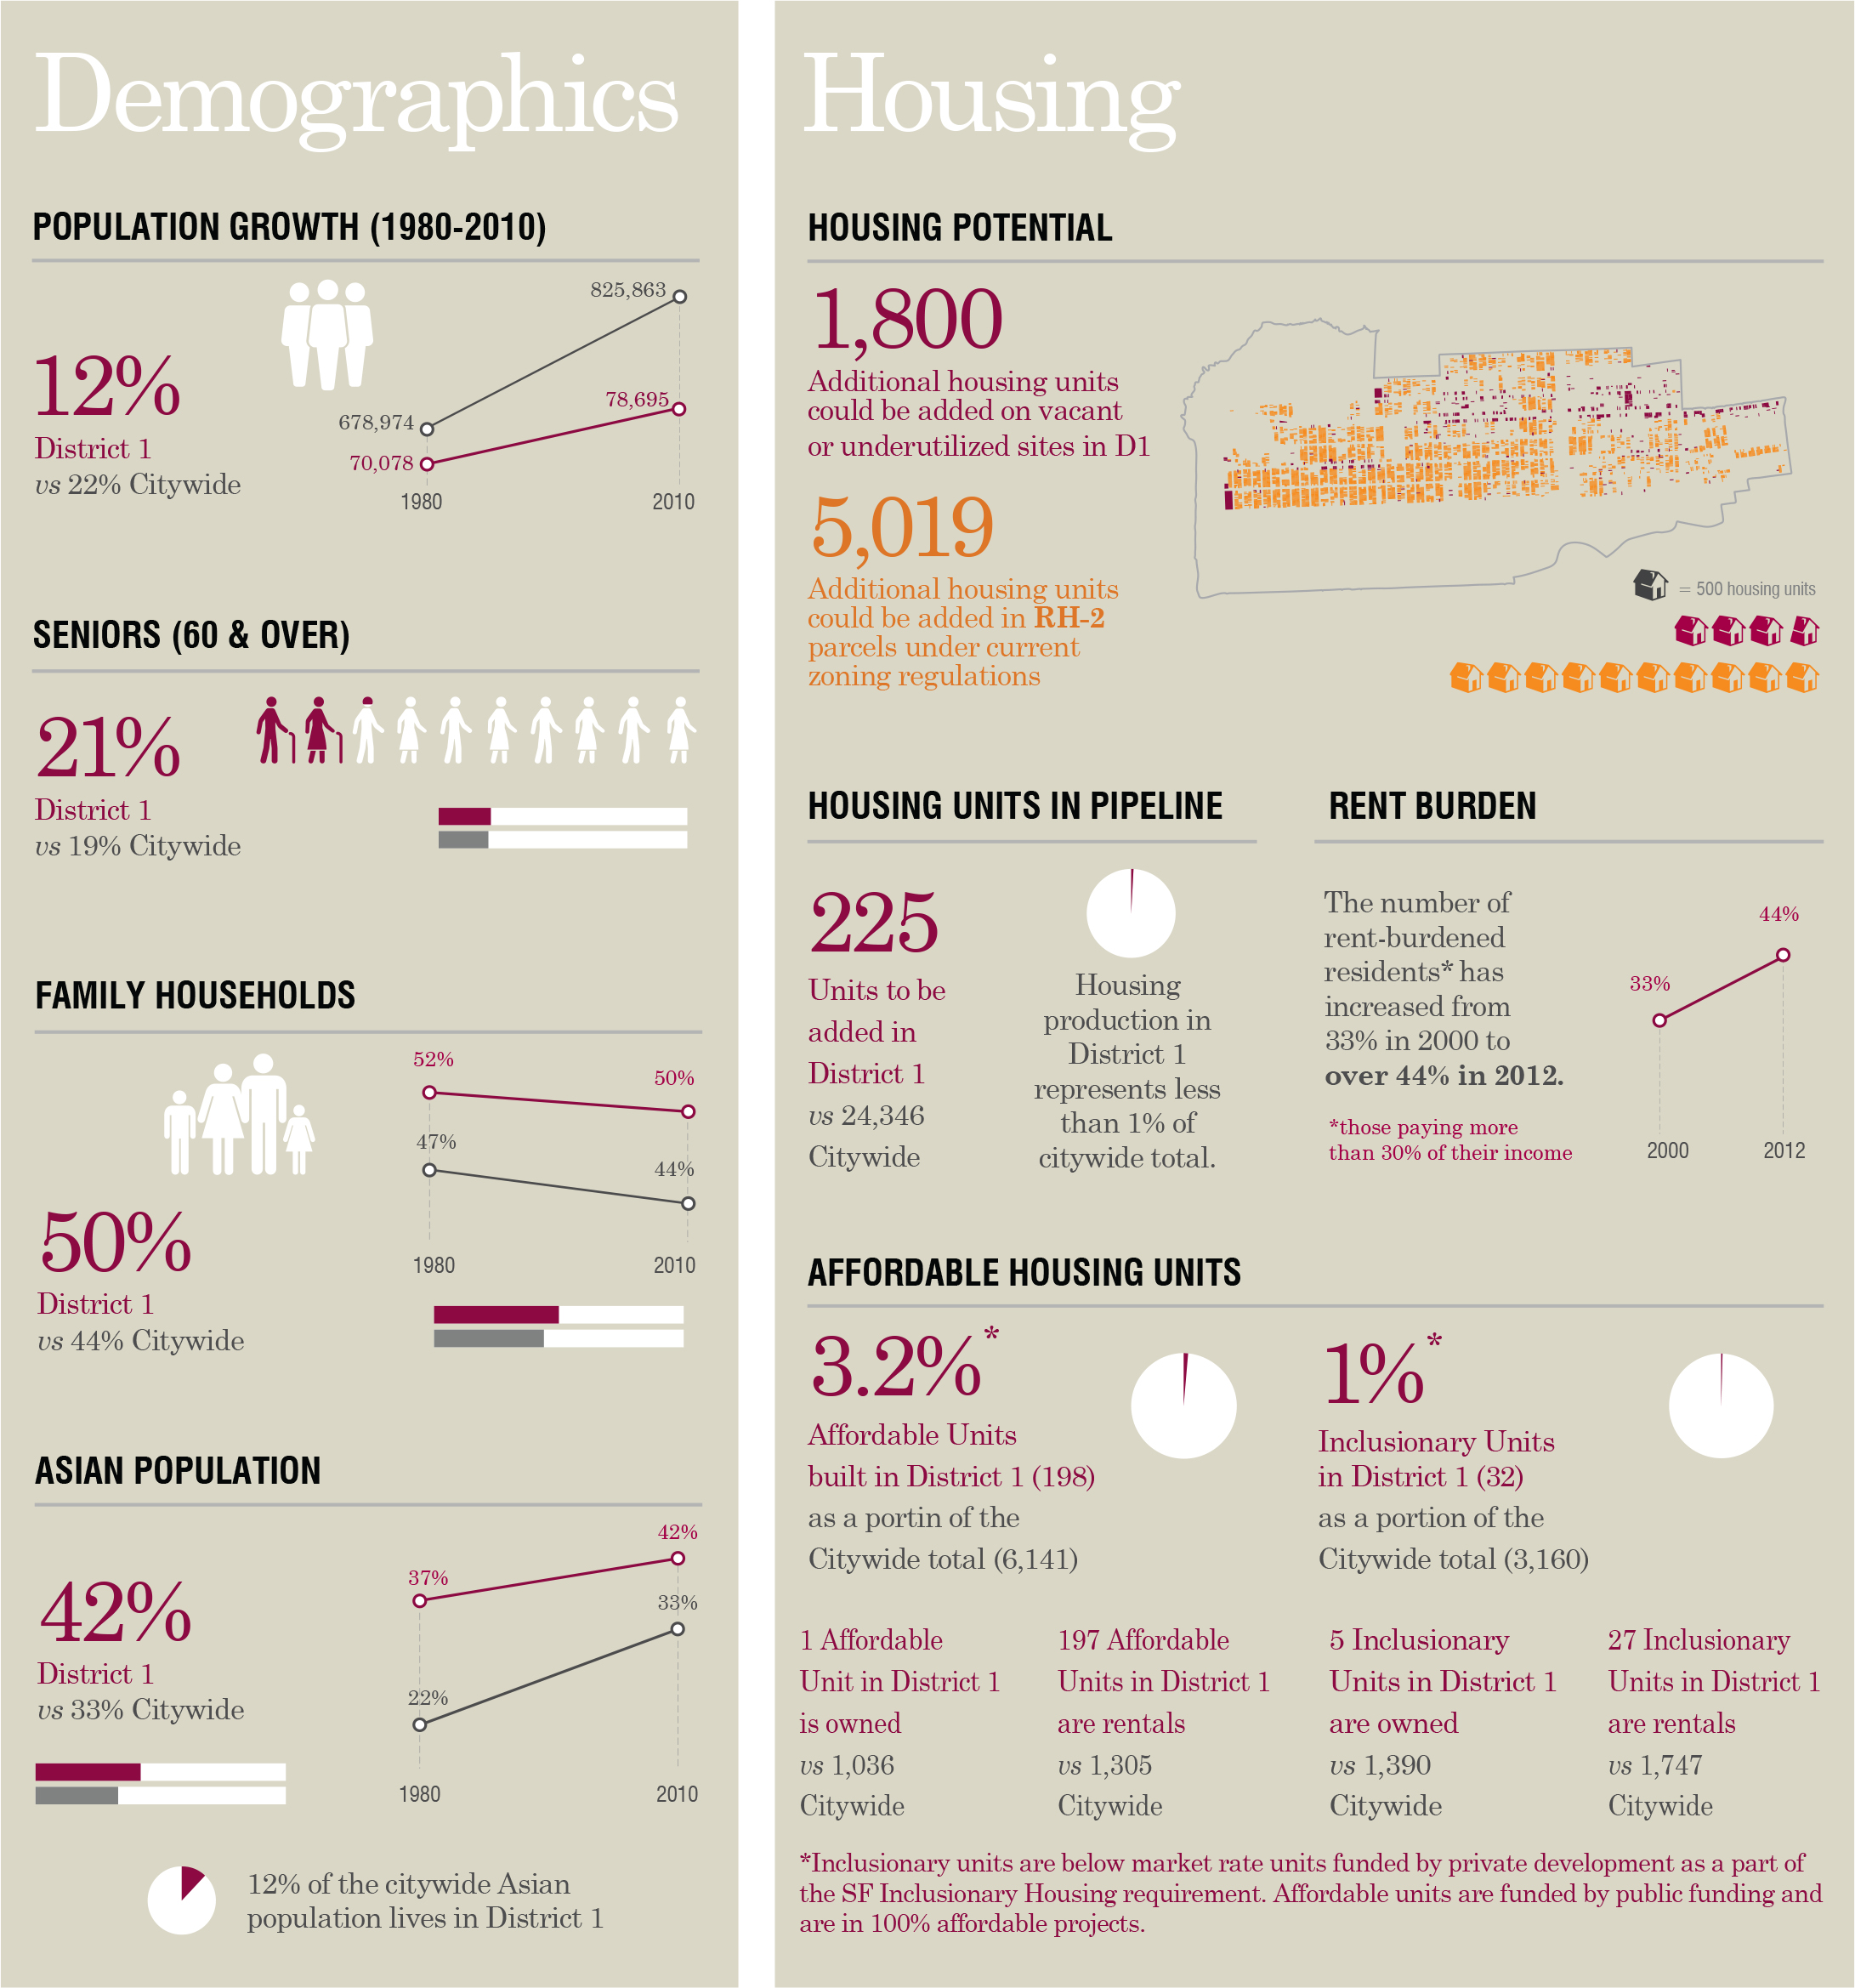
Summary findings from the Existing Conditions Report from the Richmond District Strategy Project
Summary findings from the Existing Conditions Report from the Richmond District Strategy Project
Community Needs Assessment Survey
The project recently published their findings from the Community Needs Assessment Survey. The Survey asked people to respond to questions about their needs and opinions on the following topics: housing, development, transportation and streetscape, local commercial areas, parks and open spaces, and community facilities. They received 1,413 responses, 84% were residents of District 1.
According to the survey summary, “The survey overrepresents the white population, people with higher income (earning more than $150,000 annually), homeowners, families, and single-family home residents. However, households earning between $45,000 and $150,000 annually, as well as seniors are well represented.”
Here are some of the key findings from the survey:
- More than 80 percent of respondents expressed that they do not believe Richmond has sufficient housing. The most common needs expressed were: housing for families and larger households and housing for households with income between $45,000 to $80,000. Renters and people of lower income expressed the need for these housing types at a much higher rate than owners and people of higher income.
- Overall, as income decreased, interest in development increased at higher heights and higher
affordability levels. Similarly, renters were interested in development at higher heights and higher affordability levels: 51 percent of renters found 6 or 7 story projects with higher affordability rates desirable while only 24 percent of owners expressed desire for this development type. - In order to receive improved transit service, an overwhelming majority of respondents indicated that they are willing to walk an additional block or two in exchange for better service. Even among seniors, a 60 percent majority also welcomed this idea.
- Respondents who live in the Richmond visit shops in the Richmond mostly for daily needs, restaurants, and bars, while majority of them leave the Richmond for entertainment services.
- The intersections most frequently mentioned as unsafe were along Geary Blvd between 12th Avenue and 26th Avenue. Responses also indicated an interest in pedestrian safety along Fulton Street at the north edge of the park.
- Libraries were the most commonly used facilities among the respondents, along with the museums in Golden Gate Park. Respondents also indicated a significant need for sporting facilities – courts and fields- as well as swimming pools in the neighborhood.
Click here to download the full survey findings (17MB, PDF). Results are also available in Russian and Chinese on the project page.
These findings will be interesting in light of the upcoming District 1 Supervisor election in November where housing is a hot-button topic for candidates. Everybody wants more housing, and wants it to be affordable, but at what cost?
Most of the findings in the survey support the somewhat controversial Affordable Housing Bonus Program (AHBP) which calls for increased approvals for denser developments, and much taller buildings.
The Planning Commission has approved AHBP; next it goes to the Land Use Committee of the Board of Supervisors, then the full Board of Supervisors, and finally to the Mayor’s desk pending Board approval.
For more information on the Richmond District Strategy project, including the next phase where the actual recommended strategy will be published (target: January 2017), visit the project page.
Sarah B.
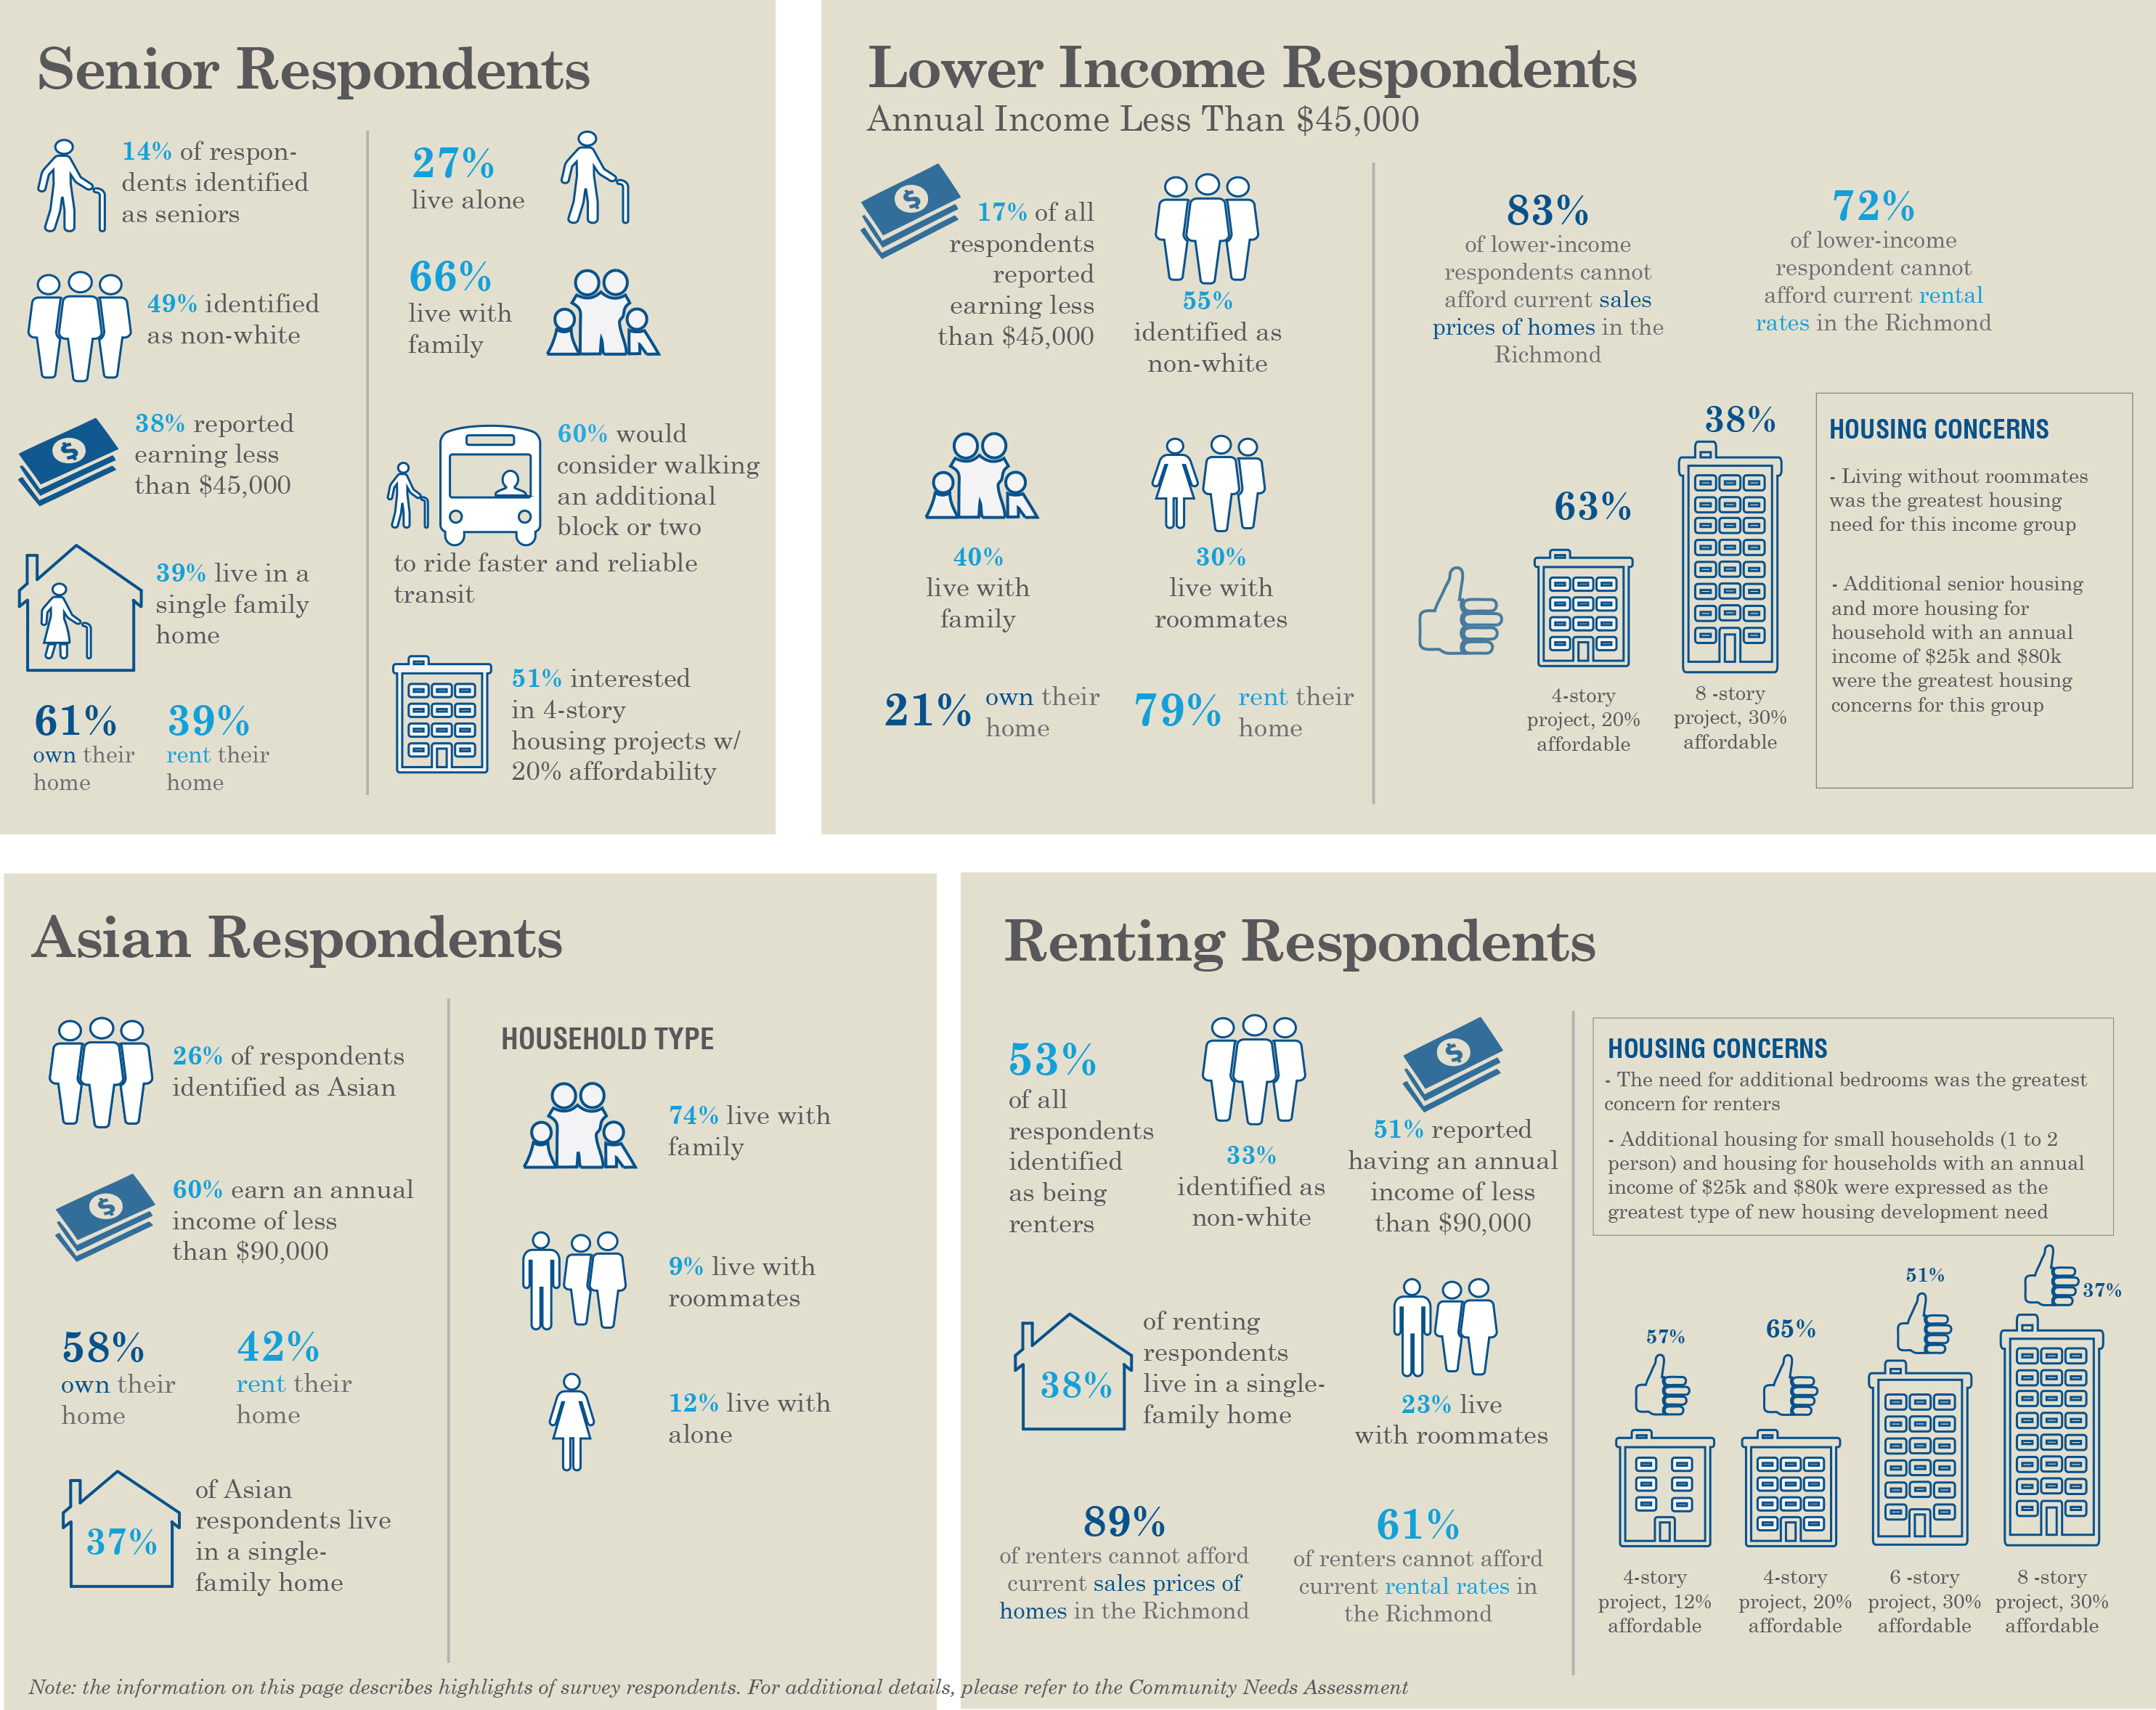
A look at respondents to the Community Needs Assessment Survey
A note about the 5,000+ units that could be developed on RH-2 parcels: many of those RH-2 parcels have existing single-family homes on them (like mine does). Our house was built here in 1950 as a typical Richmond/Sunset single-story-over-garage single-family home. There’s no way we can afford to re-develop our parcel into more than one unit. I’ll bet we’re not the only ones, so that piece of data is very misleading.
Thank you, Sarah, for posting this. Like so many neighbors, I do believe we can all benefit from a responsible and measured dialogue about housing in the Richmond District. It is not always easy to find common ground, and these surveys are just one piece in helping us envision a plan for our future out here in the Richmond District. Appreciate all you do to keep the Richmond District informed!
It’s hard for me to see that this “strategy” is another backdoor attempt to force the unwanted Geary BRT down our neighborhood throat. The BRT is closely tied to the AHPB. It will allow developers to build taller and high density housing along what will then be the Geary Tansit Corridor. I doubt that this kind of real estate development is what the family oriented residents of the Richmond Are hoping for.
I’m one of the survey respondents. The survey itself was geared almost entirely toward increasing population density and did not address any existing issues or the new issues that emerge with increased density, such as the everyday services that are getting increasingly congested and more time consuming, the shift to online shopping and increase in delivery vehicles as the trips and cashier lines are too long. Infrastructure and its lack of maintenance were an afterthought.
I see one Supervisorial candidate has taken the time to comment, it’s less than 100 days to election and I’ve seen almost no campaigning except for this one candidate’s mailers. I hope there will be more coverage so as to better differentiate those running to replace Mar.
dump BRT and invest in BART. A subway is the only way to move people faster without increasing an already heavily congested Geary. It will also allow cars, bike and pedestrians less interfence by taking away lanes. Plus the BRT adds little value in time saved. Its an UTTER WASTE OF MONEY.
one issue that needs to be addressed is the ever increasing homeless problem in the inner richmond. As the mayor and PD force homeless out of concentrated downtown enclaves, they are moving into our neighborhood where there are no services and they are becoming more desperate. there has been a camp recently set up on cornwall with open use of drugs as kids walk by to school. its inhumane to leave these people on the streets and unfair to the rest of us as well
It’s hard not to feel like this won’t end with more displaced residents and wealthier developers.
The Community Needs Assessment Survey appears to be scientific junk. No validity what so ever. The survey was not done with any identifiable standard survey methodology.
Asking people online to fill out a survey is nothing but junk science. Stopping some people in the street at events selects out people who don’t attend events. This so-called survey has so many methodological problems with it that only some one without any knowledge of how survey’s are done would pay attention to it. Of course, that may well be what the project sponsors have in mind.
As someone who had done, and was paid well for, doing real survey research in the public space, I find this type of thing not only unsettling but down right dangerous for public policy. Making any decision based on this data is a bad idea.
Where is the research methodology report that shown that the survey respondents (the small “n”) in fact are a representative sample of the population of the whole (the big “N”)? What was the confidence intervals? What is the margin of errors? I took a quick look at their so-called survey and I did not see any of that. Their so-called Survey methodology is pure crap.
Junk science. Welcome to the new Dark Ages people.