This one’s for all you police blotter fans out there… 😉
When you hear sirens here in the Richmond District, don’t you often wonder, even if just for a moment, “I wonder what’s going on…”
To help answer those types of questions, the SFPD has a crime map website where you can look up what crimes are taking place in your neighborhood. However, their site is old, doesn’t work with many web browsers, and is not very easy to explore.
Enter San Francisco Crimespotting, a website designed and built by Stamen Design, a local design and technology studio. Their site is a fast, easy to use crime map that leaves the original SFPD site in its dust.
So what makes their crime map better than the original? “Our map view is completely explorable – it’s possible to pan and zoom, select date ranges in the past, and view specific kinds of crimes. You can also share links directly to a particular view of the map, which is important for sharing and publishing information.”
Ultimately, their goal is to make public information like crime data more accessible, and present it in a way that is not only easy to use, but useful too. “We’ve found ourselves frustrated by the proprietary systems and long disclaimers that ultimately limit information available to the public. As citizens we have a right to public information. A clear understanding of our environment is essential to an informed citizenry.”
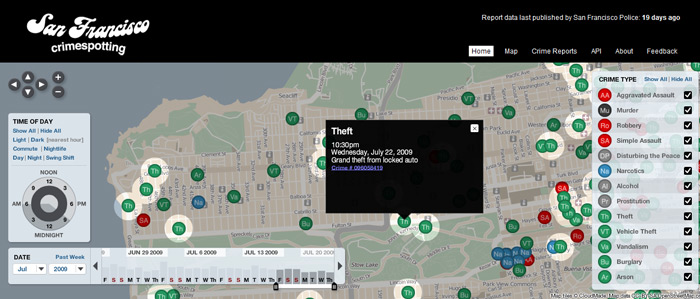
The site has a lot of handy features including a time of day menu where you can view crimes by day, night, commute time, and even when it’s light or dark outside. Alongside the map is an easy to read legend that helps you quickly identify what each crime dot means on the map. Hover your mouse on one type of crime and the map goes dim and lights up the same types of crimes elsewhere across the map.
Click on a dot and you’ll see a synopsis of the incident, including the crime number which when clicked, takes you to a page where you can leave a comment “if you are familiar with the incident, believe we have incorrect information about the crime report, or know of a mention in the local news media such as the San Francisco Chronicle. We also welcome the posting of details obtained directly from San Francisco Police Department crime report requests.”
Looking at the entire city map is interesting too. And as a Richmond District resident, also reassuring. I couldn’t help but be relieved when the densest cluster of dots was not in my own neighborhood.
The best way to see what San Francisco Crimespotting has to offer is try it out for yourself. So if you’re into crime statistics or just want to know what’s happening crime-wise in your neighborhood, be sure to bookmark sanfrancisco.crimespotting.org.
Sarah B.
Much better than the city site. If you were to get more current data (22 days old) and add an animation it gets my vote Watson!